Intel’s Core i9-12900HK indeed fulfills the company’s proclamation of being the “The fastest mobile processor. Ever,” based on the results of our early, exclusive hands-on performance testing of several 12th-gen laptops.
Intel, which unveiled its 12th-gen Alder Lake laptop CPUs just last week at CES, let PCWorld take four nearly identical laptops outfitted with the Core i9-12900HK for a spin during a live stream of our Full Nerd podcast. You can watch us run the benchmarks live in the recording of our live stream below, or check out the video version of our performance analysis over here.
While the four preproduction laptops aren’t quite final units, they’re based on MSI’s GE76 Raider with final drivers, firmware and tuning still to come. The laptops were outfitted with the 14-core Core i9-12900HK CPU, an Nvidia GeForce RTX 3080 Laptop GPU, 32GB of DDR5/4800 RAM, and Windows 11. The updated GE76 remains the same externally as the previous-gen model, but there have been some upgrades to it, including a new MSI “phase-change liquid metal” thermal pad that boosts the CPU’s performance. MSI has also tweaked the 12th-gen laptop’s GPU to 175 watts, versus the 11th-gen version’s 165 watt TGP GPU.
We ran all but the gaming benchmarks on laptops set to MSI’s balanced profile, rather than its extreme performance profile, and also set to hybrid GPU mode rather than discrete mode. That’s actually how Intel set the laptops up in its lab, which we left intact. Normally we’d opt for the higher performance profile to get the best possible performance, but we left them as set and just wanted to point it out to shoot down assumptions that Intel might have “rigged” this performance preview by opting for the maximum cooling settings.
We picked the tests we wanted to run, and ran them ourselves live on The Full Nerd (subscribe to PCWorld’s YouTube channel if you aren’t already), but make no mistake—these are laptops from Intel’s own testing labs so you should always read the results with some modicum of salt until independent reviews are performed. We do believe the CPU performance you see here is likely be fairly representative of performance the production laptop reaches. But no two laptops are the exact same—even among the same make and model—so you should expect a little variance in high-end Alder Lake gaming laptops, but hopefully not huge swings.
You should know, however, that a CPU and GPU’s performance isn’t static. The magic each PC maker brings to it in cooling, tuning, and chosen parts can have very large impacts on performance. Basically, there is no such thing as completely isolating the CPU in a laptop. You must evaluate performance based on the total platform, not just the CPU or GPU inside of it.
To give you a point of comparison, we’ve included two additional laptops:
- The previous-generation MSI GE76 Raider outfitted with an 8-core 11th-gen Core i9-11980HK, Nvidia GeForce RTX 3080 Laptop GPU with a TGP of 165 watts, and 32GB of DDR4/3200. This laptop set to its Extreme performance setting.
- An Asus Strix Scar G17 outfitted with AMD’s 8-core Ryzen 9 5900HX, Nvidia GeForce RTX 3080 Laptop GPU with a TGP of 130 watts, and 32GB of DDR4/3200. This laptop was tested set to Turbo.
Unfortunately, due to our time constraints we were unable to update the 11th-gen Core and Ryzen 9 laptops to Windows 11. Fortunately, for many of the CPU benchmarks we ran, the OS difference can be minimal.
Intel Core i9-12900HK performance preview
We’ll kick off our preview with Maxon’s popular Cinbench R20 using its default multi-threaded test. Cinebench is based on the company’s Cinema4D 3D modelling and rendering engine that’s sold as a stand-alone application and also included in other products, such as Adobe’s After Effects. It hugs cores to its body, and more cores means more speed. The results we see aren’t much of a surprise when you remember that Intel’s 12th-gen Alder Lake H processors feature a hybrid design, using six improved “performance cores” coupled with eight “efficiency cores” in this flagship Core i9-12900HK. That means 14-cores (even if eight of them are lighter weight than the Ryzen’s and 11th gen cores) nets more performance in Cinebench R20.
Still, you’re looking at the 12th-gen Core i9 outpacing the Ryzen 9 5900HX and the Core i9-11980HK by roughly 30 percent.
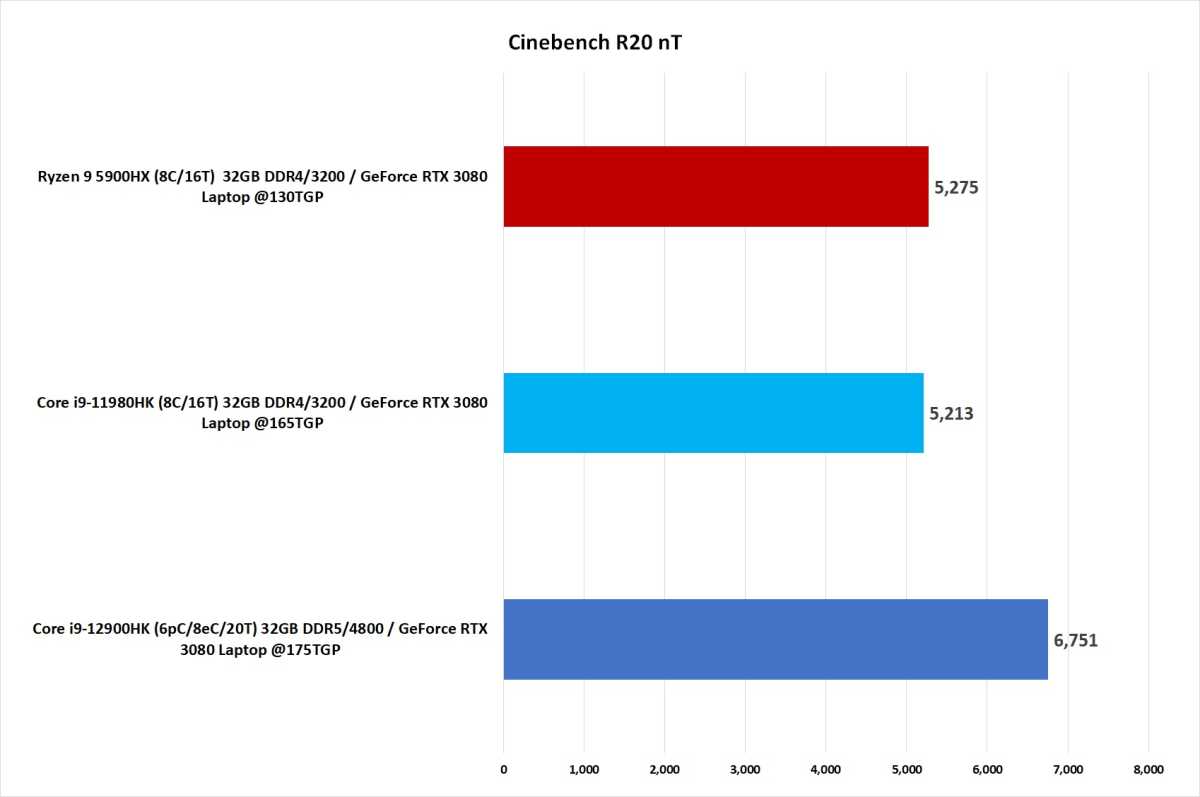
Longer bars indicate better performance. Right mouse click and select “open in new tab” to see original image.
IDG
As much as we wish they would, the vast majority of applications people use don’t tap into every core available. In fact, single-core performance may matter what for what you do everyday more than multi-core performance, so we also ran Cinebench R20 using a single-thread to gauge performance there.
Intel’s 12th-gen “Alder Lake” cores greatly boost efficiency per clock and we see that manifest itself here, where the 12th gen Core i9-12900HK is roughly 16 percent faster than the Ryzen 9 5900HX and 9.3 percent faster than the 11th gen Core i9-11980HK. Mind you, neither of those rival CPUs are slow chips either. Last summer, in fact, it felt like AMD’s newly released Ryzen 9 5900HX was a monster compared to all previously released CPUs, which was then itself somewhat eclipsed by the equally impressive 11th Core i9-11980HK. Obviously, there’s a new goliath in town.
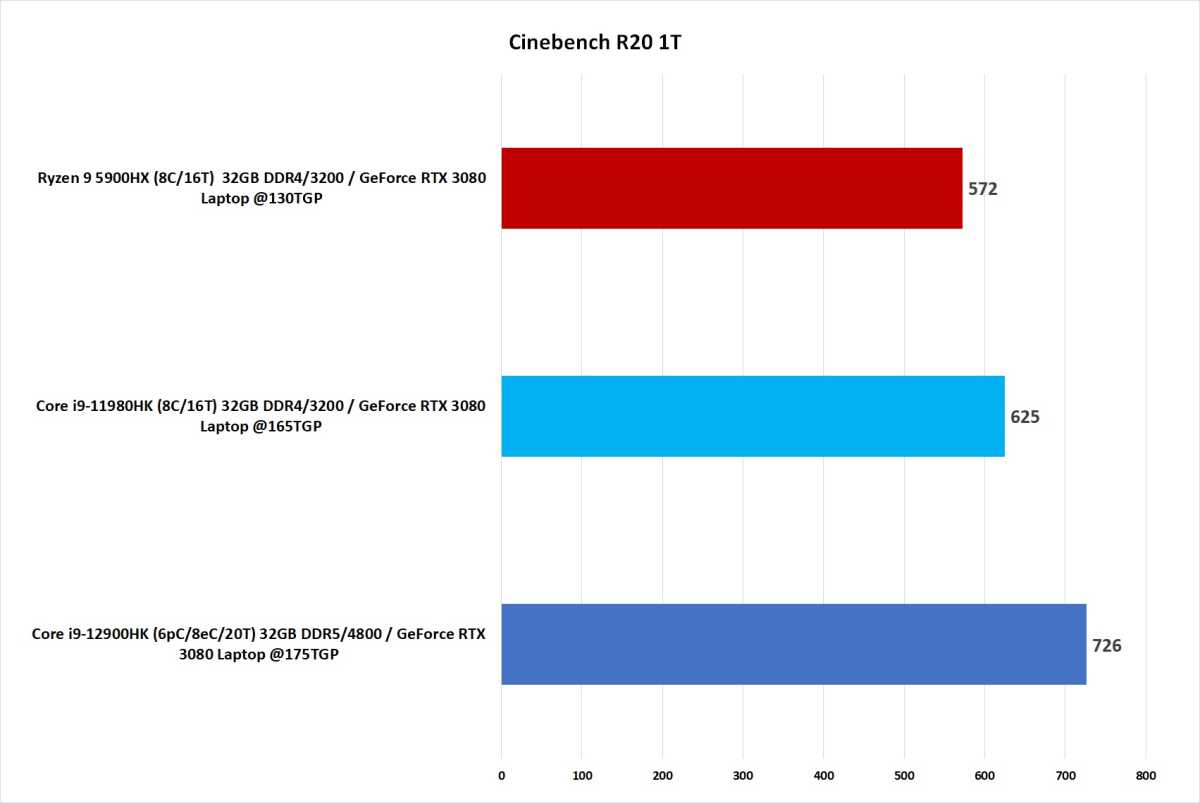
Longer bars indicate better performance. Right mouse click and select “open in new tab” to see original image.
IDG
Up next is the very similar Cinebench R23, which unlike Cinebench R20, takes about 10 minutes to run. That point is important because modern CPUs all generate heat as they run and ease off the pedal when they heat up. While Cinebench R20 takes maybe a minute or so to run, the 10 minutes of Cinebench R23 is likely to depress performance. The good news for 12th-gen is it’s still the winner, since 14 cores is still more than 8 cores. The performance difference between the CPUs close up a little but the Core i9-12900HK still offers a commanding 23 percent advantage over the Ryzen 9 5900HX and 16 percent over the 11th-gen Core i9.
One other advantage to running Cinebench R23 is Mac fans can also compare performance directly, since Maxon’s Cinebench R23 has native version for Apples new M1 line. While we have not directly tested the MacBook Pro 14, our sister publication Macworld has, and recorded a score of 12,381 for the MacBook Pro 14 with its 10-core M1 Pro CPU. That would give the 12th gen Core i9-12900HK a 21 percent advantage over a MacBook Pro 14. Macworld didn’t review the M1 Max, but others outlets have outlets have reported performance to range from 12,300 to 12,700 for the faster M1 Max.
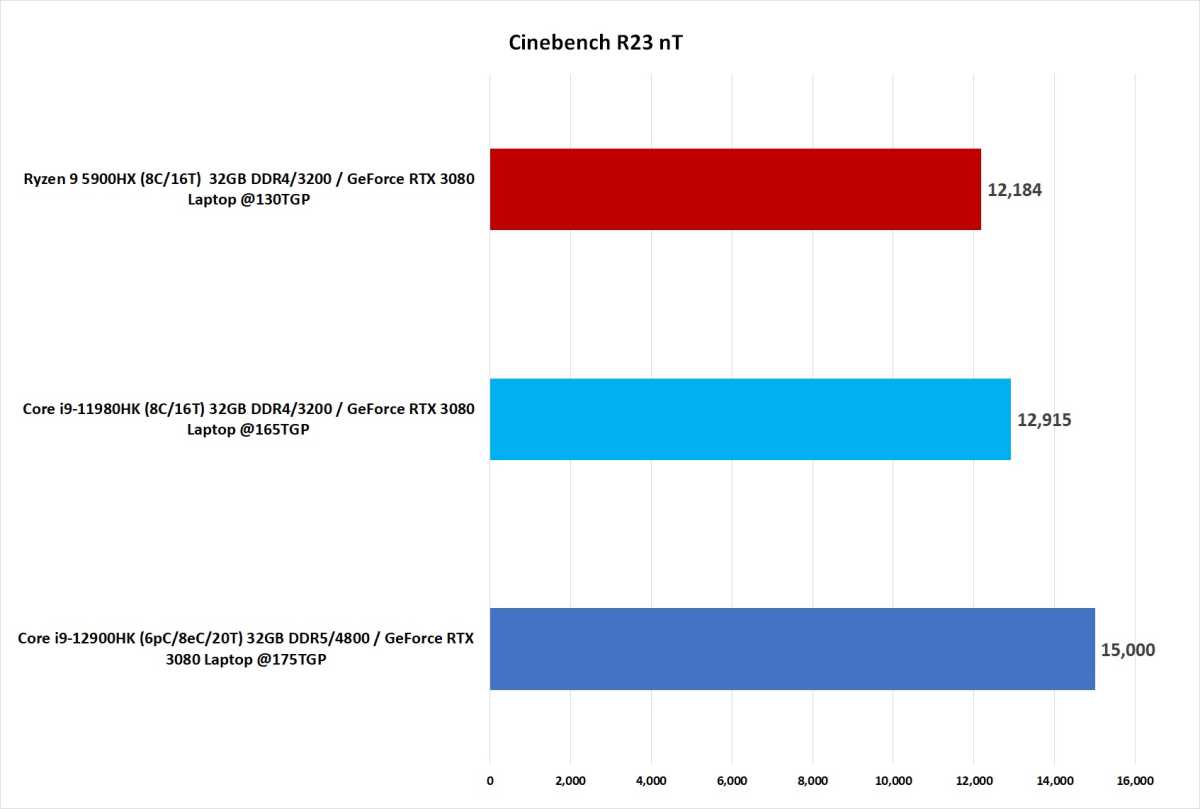
Longer bars indicate better performance. Right mouse click and select “open in new tab” to see original image.
IDG
Like Cinebench R20, we also record a score in Cinebench R23 using a single thread. Interestingly, we actually see the gap open up a little here, with the 12th gen Core i9-12900HK outpacing the Ryzen 9 5900HX by about 26.5 percent and the 11th gen Core i9-11980HK by 16.6 percent. For the M1 Pro in the MacBook Pro 14, Macworld recorded a score of 1,531. That’s an advantage of 23.6 percent for the 12th-gen CPU over the M1 Pro.
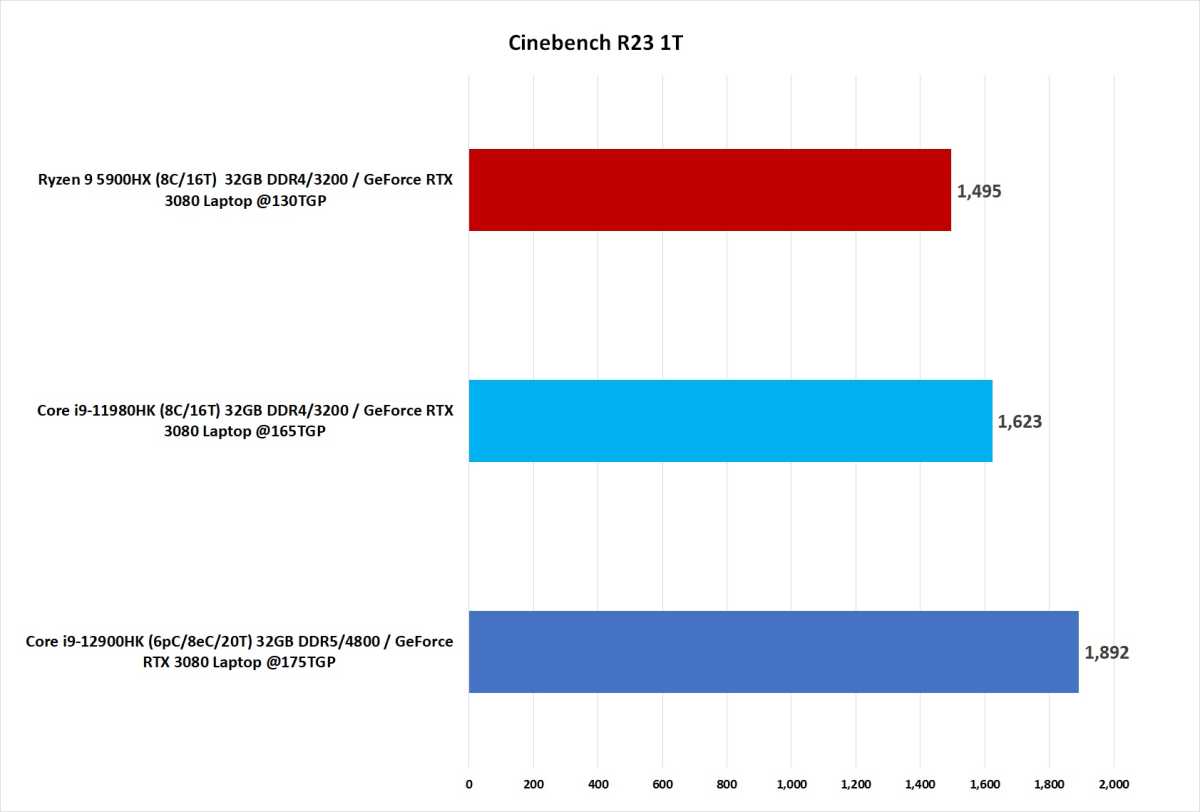
Longer bars indicate better performance. Right mouse click and select “open in new tab” to see original image.
IDG
Up next is BAPCo’s CrossMark benchmark. It’s essentially a scaled-down version of its sprawling SYSMark test, which uses real applications to gauge performance. But rather than commercial applications, CrossMark is built using open-source programs and intended to gauge productivity, creative (photo and video), and responsiveness, which it defines as switching between software or starting an application. It’s compiled with open-source compilers and is designed to run on Windows, MacOS, iOS and Android alike. On the Windows PCs, the 12th-gen Core i9 is a beefy 36 percent faster than the Ryzen 9 5900HX and also impressive 21.5 percent faster than the 11th-gen Intel chip.
Again, we didn’t have a score for CrossMark for MacOS, but the public database BAPCo publishes puts the fastest M1 Max laptop at 1,670, which lands the Core i9-12900HK at about 18 percent faster. Like all public benchmark databases, it’s always hard to know the provenance of the results, but we’ll hope for the best. Looking into the details, M1 Max does slightly outpace the 12th-gen Core i9 in the Creativity portion, with a score of 2,254 vs. the 12th gen’s 2,132, but the newest Intel CPU beats it in productivity by 25 percent with a score of 1,874. Interestingly the Alder Lake H system also crushes the M1 Max in CrossMark’s “Responsive” test to the tune of 59.9 percent, with a score of 1,836 for the Core i9.
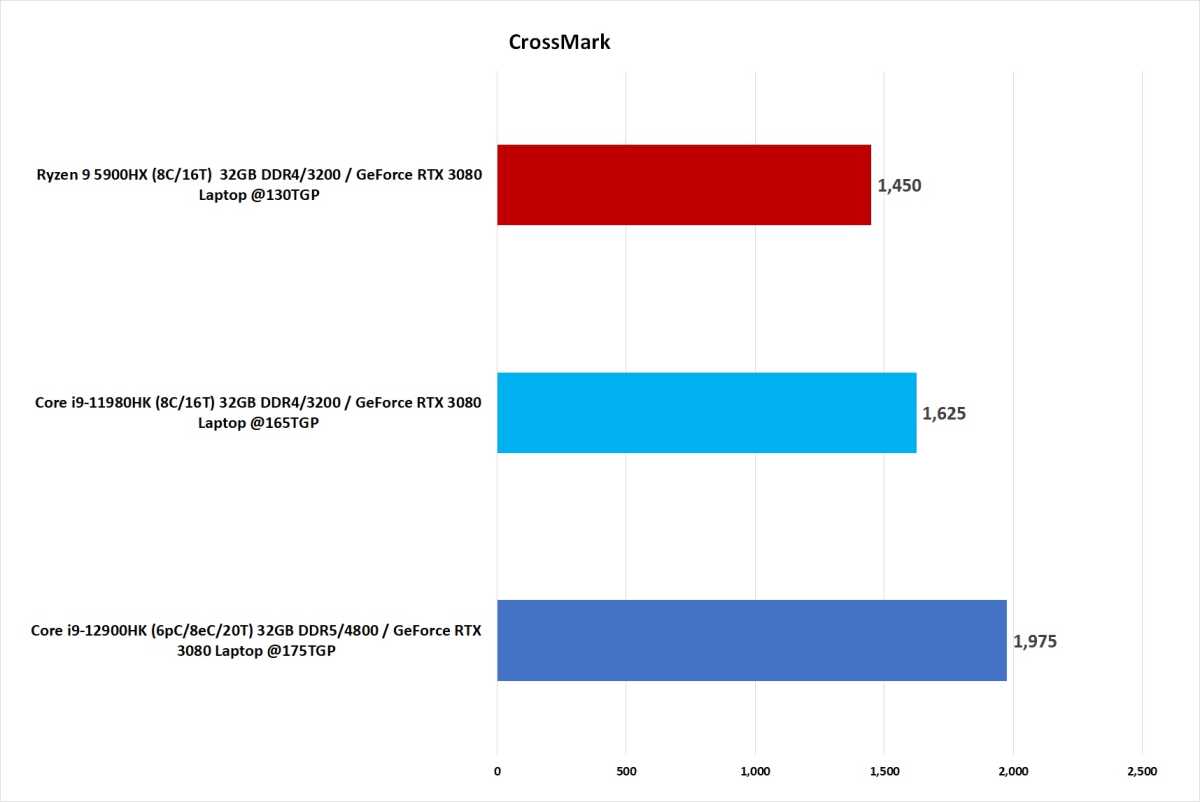
Longer bars indicate better performance. Right mouse click and select “open in new tab” to see original image.
IDG
All-in-one suites such as CrossMark attempt to measure everything you might do on your computer, but the vast majority of the world brings home the turkey bacon using Microsoft’s Office suite. So to keep Bill Lumberg happy, we also ran UL’s Procyon Office test, which uses Microsoft Word, PowerPoint, Excel, and Outlook to simulate what most people do all day while waiting for 5 p.m. to come. The 12th gen Core i9-12900HK wins, but it’s really just a meh, with Intel’s new chip outpacing the 11th-gen Core and Ryzen 9 systems by only 5 percent. Frankly, if you’re using a Core i9 or Ryzen 9 with a GeForce RTX 3080 to primarily pound out a PowerPoint, you’re probably doing it wrong.
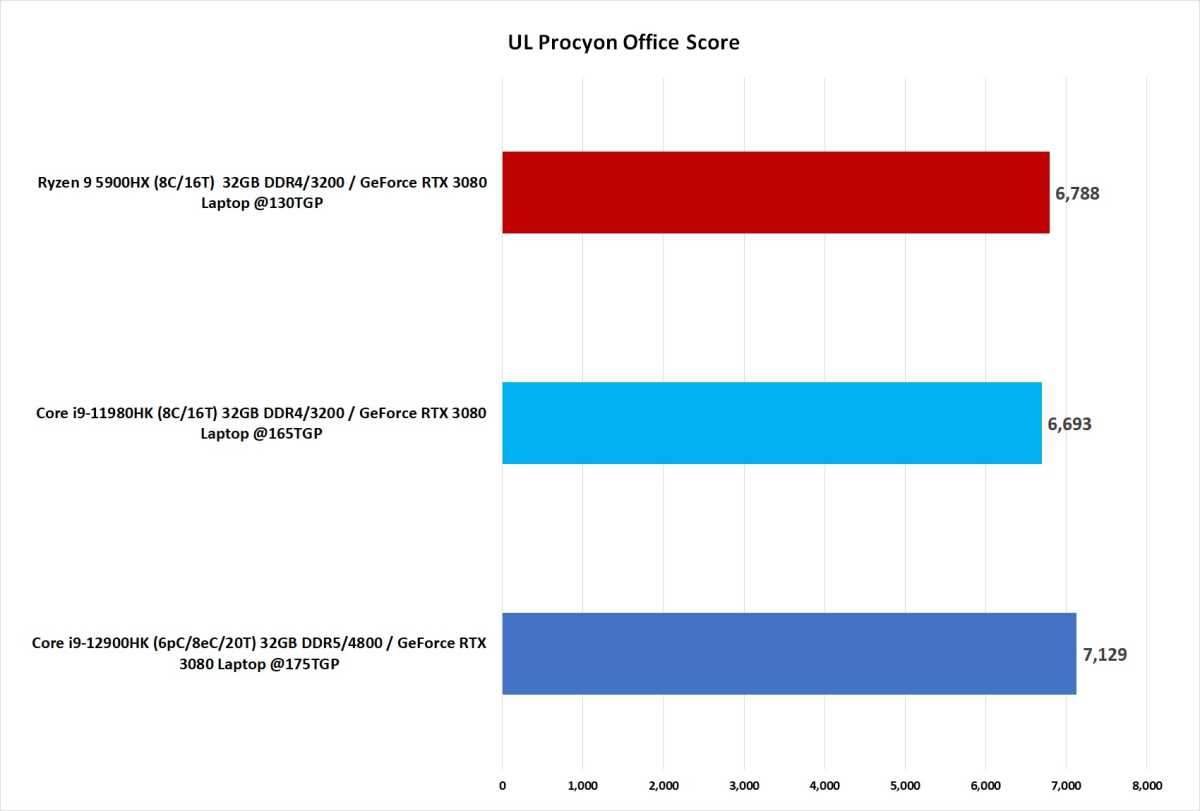
Longer bars indicate better performance. Right mouse click and select “open in new tab” to see original image.
IDG
Our next result is Principled Technologies WebXprt 3. It’s a web-based benchmark designed to measure browser performance at photo enhancement, organizing an album using AI, stock option pricing, encryption notes, OCR scans, sales graphs, and online homework. These are fairly advanced features for a browser test. All of our results were generated using Edge on the Chromium 97.
The Core i9-12900HK again leads the field, turning in a score about 9.5 percent faster than the 11th-gen chip and 16.2 percent faster than the Ryzen 9.
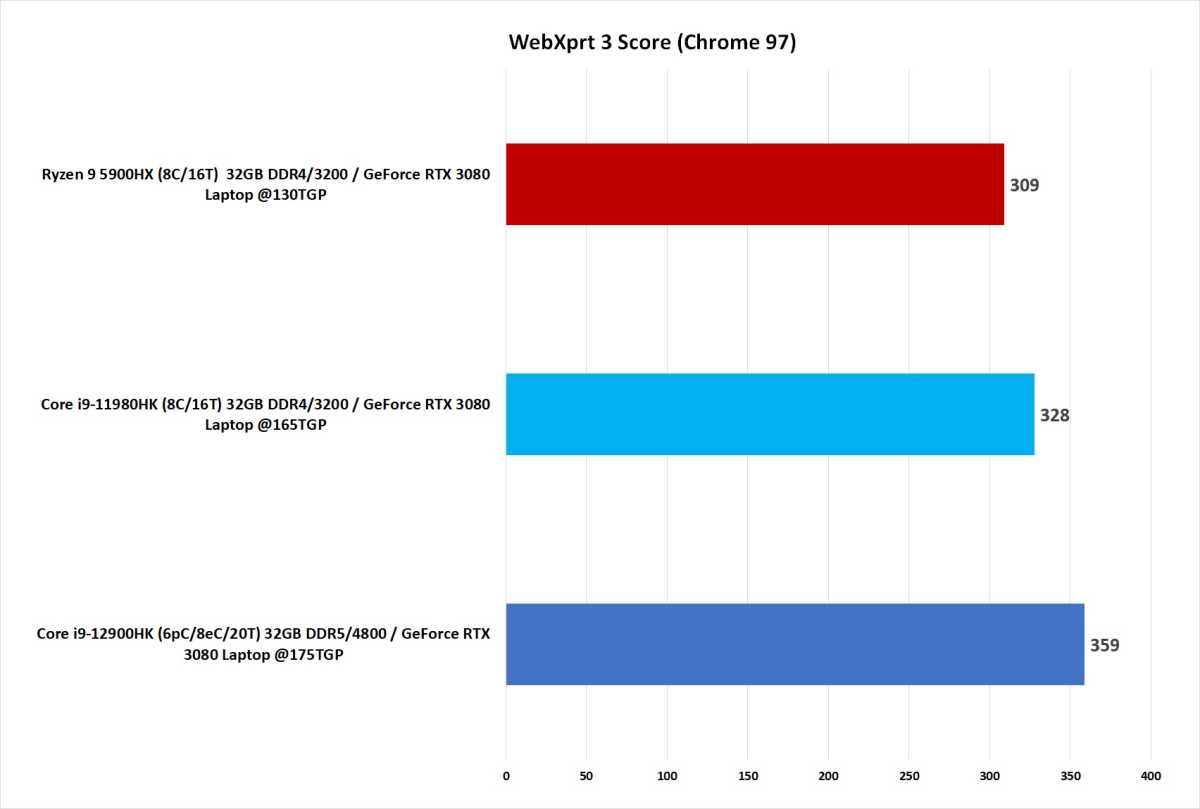
Longer bars indicate better performance. Right mouse click and select “open in new tab” to see original image.
IDG
We did manage to run games on the 12th gen Core i9-12900HK, but there are a lot of caveats with our comparison that we really want to highlight in yellow. Although all of the laptops feature GeForce RTX 3080 Laptop GPUs, their power ratings weren’t the same, which can make any comparison in gaming really sketchy. That’s especially true for the Ryzen 9 system, which was paired with a GPU rated at 130 watts vs. the 11th-gen’s 165 watts, and the 12th-gen’s 175 watts. That’s basically a 27 percent larger thermal and power budget for the 11th-gen laptop and 35 percent for the Core i9-12900HK laptop. Between the 11th-gen and the 12th-gen, there’s only about a 6 percent difference in GPU power.
That said, should also point out that one of the problems we saw last year was difficulty in getting a lot of gaming laptops with higher wattage GPUs. So if most 165 watt GPUs were only in Intel machines, then maybe it’s actually a fair comparison?
Gaming performance isn’t always about GPU wattage though and we see that below in our first result from Ashes of the Singularity: Escalation. We ran this benchmark at 1080p using the Crazy preset for graphics and opt for the CPU-focused benchmark run. The CPU-focused benchmark puts more units on the screen, which should push the CPU harder than the regular GPU-focused test. You can see the Ryzen 9 and 11th-gen systems are dead-even despite have a sizeable GPU thermal budget difference. That actually makes us even more impressed by the Core i9-12900HK’s 11.7 percent lead over the others. The test basically doesn’t seem to care about GPU wattage yet Intel’s new chip is ahead by double-digits in the CPU test.
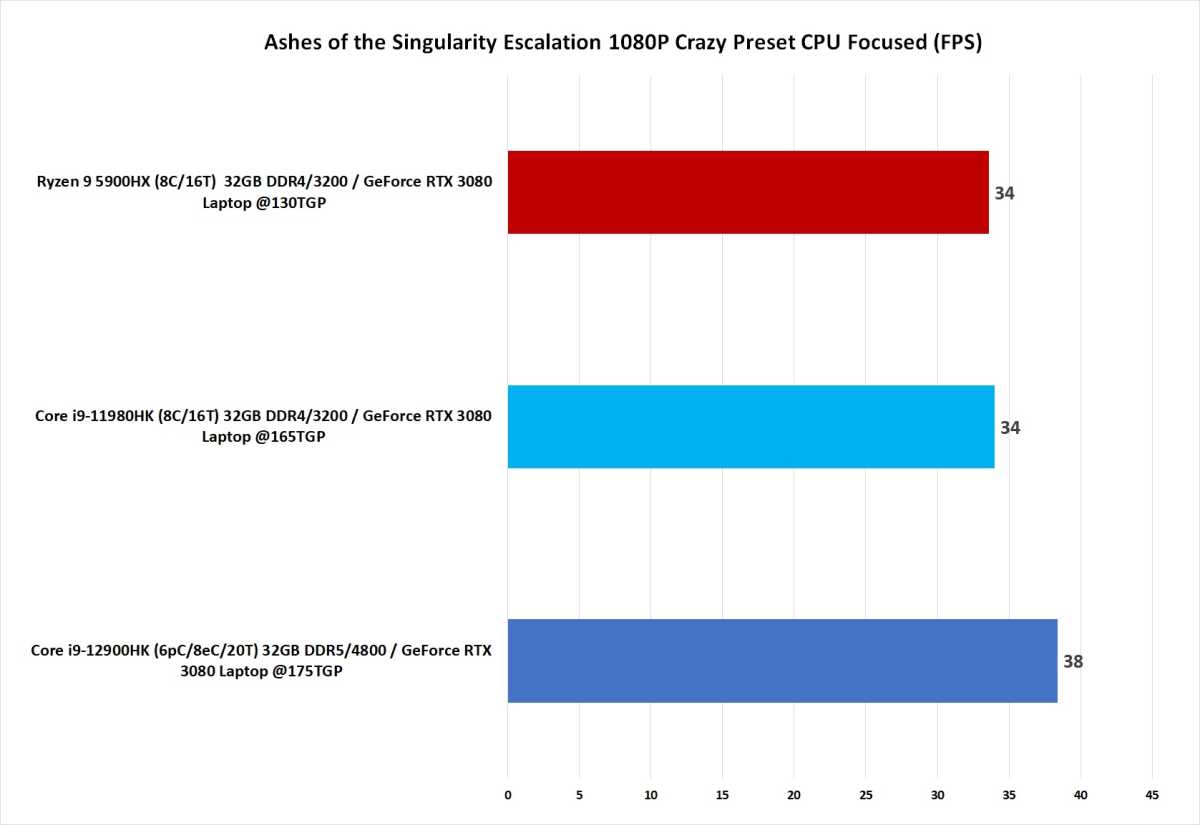
Longer bars indicate better performance. Right mouse click and select “open in new tab” to see original image.
IDG
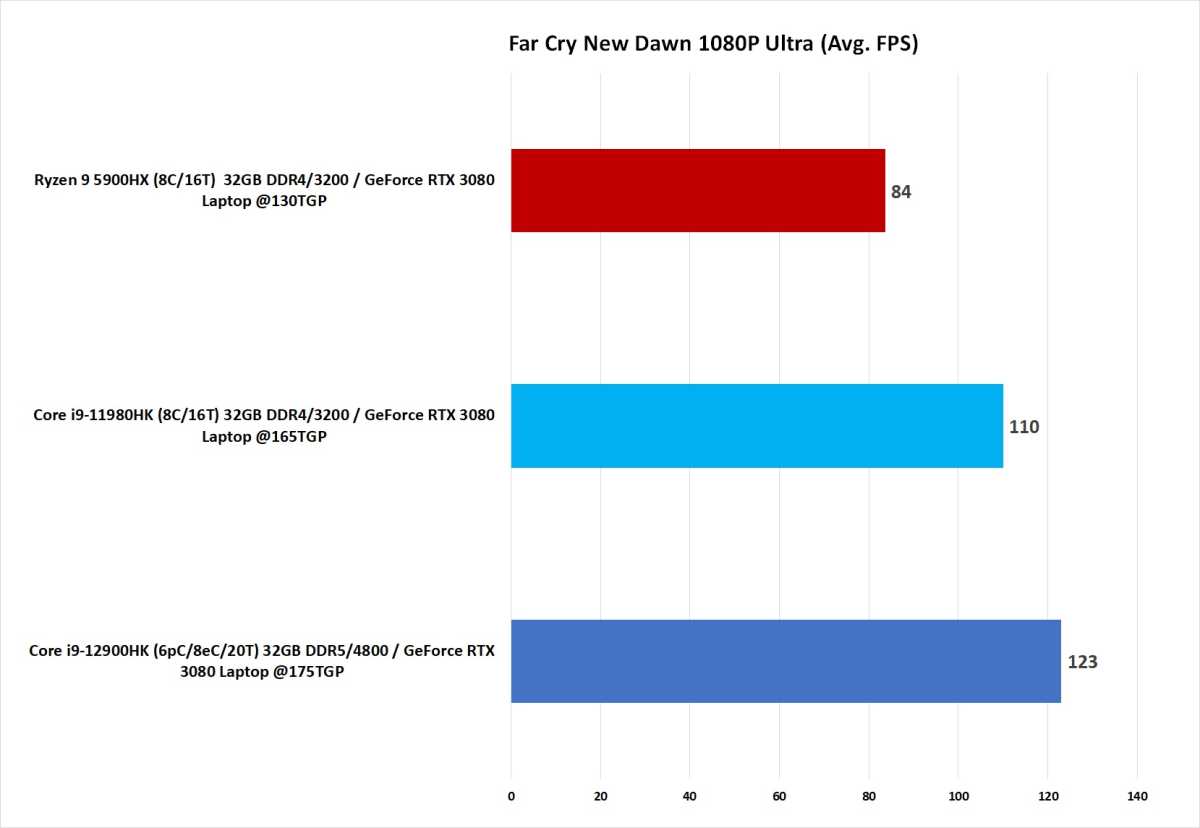
Our next game result is Far Cry New Dawn run at 1080p using the ultra preset. The caveat here is this game series has long given AMD’s chips the raspberry, but that changed with the Ryzen 5000-series of desktop chips, which saw AMD actually eclipse Intel’s best 10th-gen desktop chip at last. The laptop Ryzen 5000, however, features less cache, which may not give it the same boost. Still, given the 35 percent larger GPU thermal budget in the Core i9-12900HK laptop, we don’t think it’s necessarily fair to make direct comparisons with the Ryzen 9 system, so consider it there for reference.
We do think it’s fair to compare performance against the 11th-gen GE76 Raider, however, since both GPUs are separated by just 10 watts of power. The 12th-gen GE76 with a Core i9-12900HK inside pulls up the win by double digits, with a frame rate about 11.8 percent faster.
Longer bars indicate better performance. Right mouse click and select “open in new tab” to see original image.
IDG
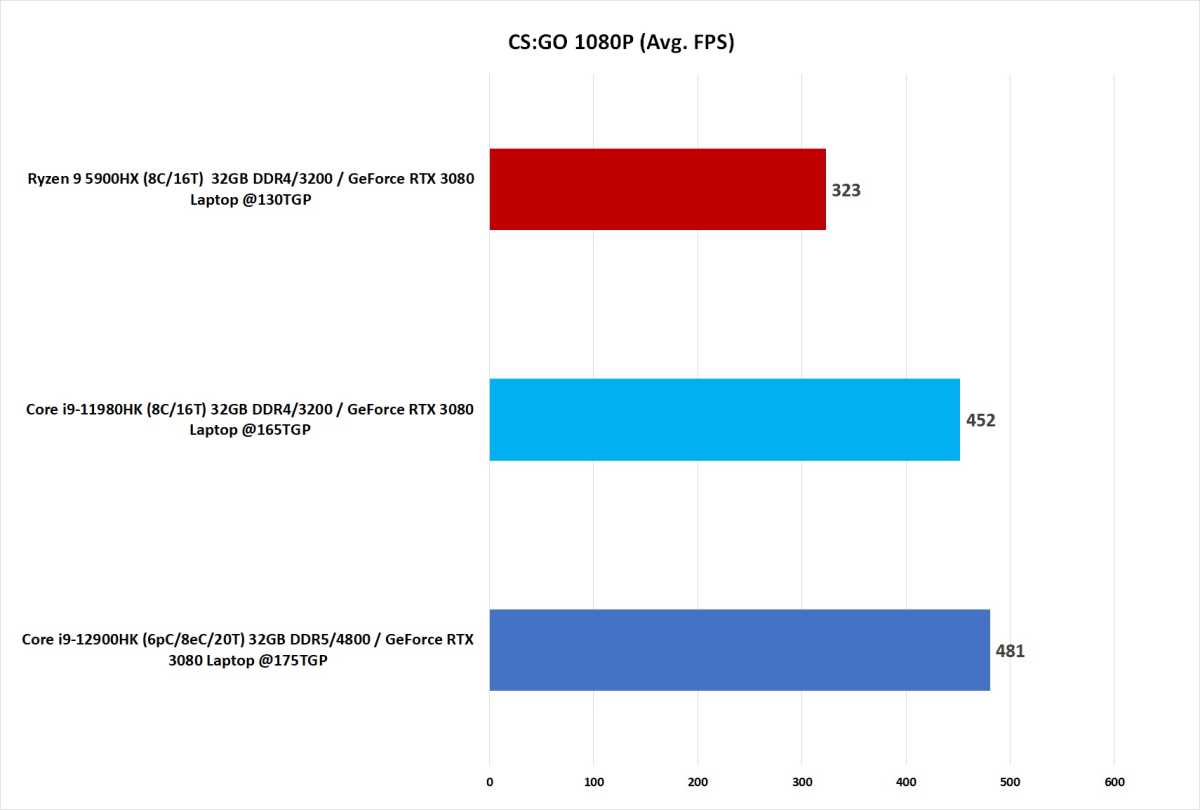
Our last game result is from the popular Counter Strike: Global Offensive which is a graphically low-intensity game in this age. We assumed that would make it mostly a CPU-intensive game, but the results interestingly mostly mirror the GPU wattage differences between the different laptops. The Core i9-12900HK laptop is still faster than the 11th-gen notebook, but we’re oly looking at roughly a 6 percent win. We’ll just have to wait for final drivers to really make any determination in gaming.
Longer bars indicate better performance. Right mouse click and select “open in new tab” to see original image.
IDG
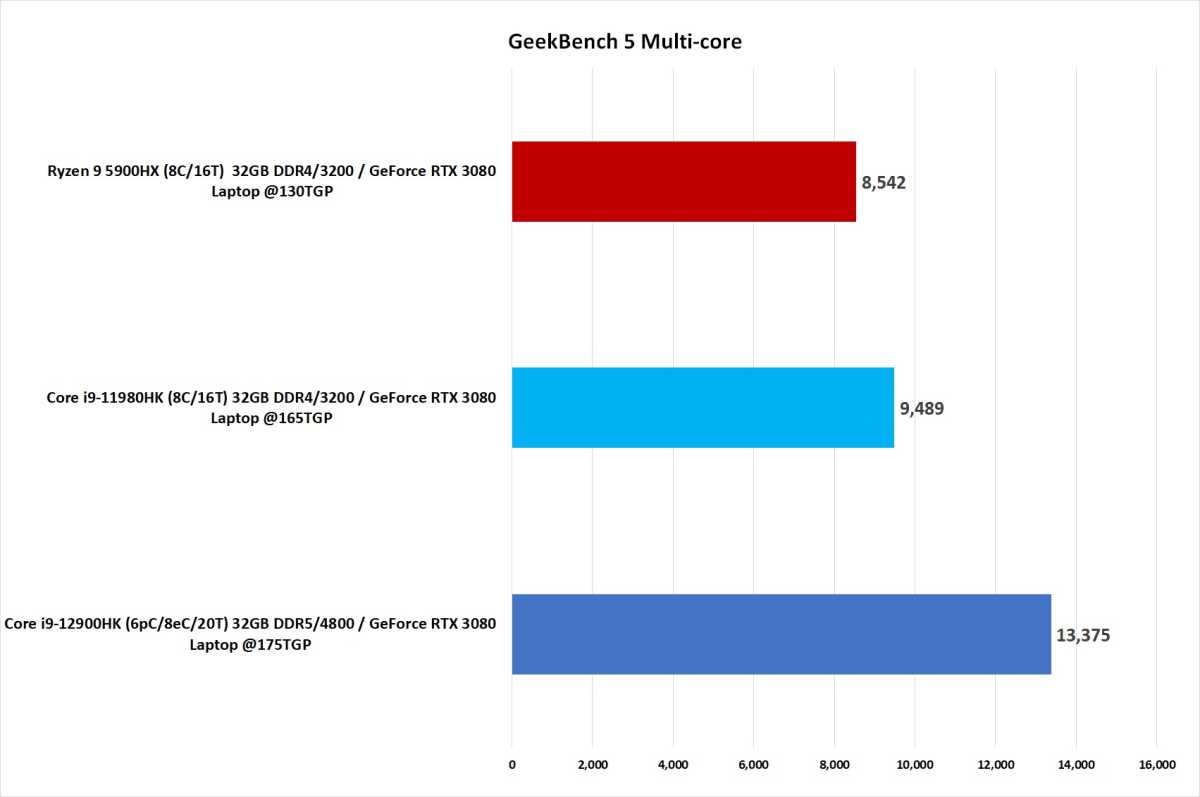
We saved our last official result for the Official Benchmark of Twitter Shouting Matches: Geekbench 5. It’s a popular, cross-platform benchmark based around a set of small programming “loops” that are designed to simulate various functions such as JPEG decompression, text decompression, encryption, AI and more. We find most of Geekbench’s value to be in the sub-scores that let you dive into each individual result’s performance. We also generally only compare results on the same platform. But that’s not how Twitter hot takes are created, so we’ll stick with just the overall score here.
The result gives the Intel Core i9-12900HK a massive 56.6 percent advantage over the Ryzen 9 5900HX chip. The 12th-gen chip is equally impressive compared to its predecessor, with a 40 percent increase in performance over the 11th-gen Core i9. Again, it’s worth remembering that these are not slow CPUs, with the 11th-gen Core and Ryzen 9 chips delivering jaw-dropping performance just last summer—making the 12900HK’s win all the more staggering.
We don’t have an in-house score for the M1 Pro, so we’ll crib from Macworld again. It reports a score of 12,590 for the 10-core M1 Max and a score of 12,544 for the 10-core M1 Pro. That puts the M1 Max just 6 percent away from the 12th-gen Core i9, and although Geekbench’s utility as the final word on performance has some real limits, it’s still an impressive showing nonetheless for both Apple’s M1 and Intel’s 12th-gen chips.
Longer bars indicate better performance. Right mouse click and select “open in new tab” to see original image.
IDG
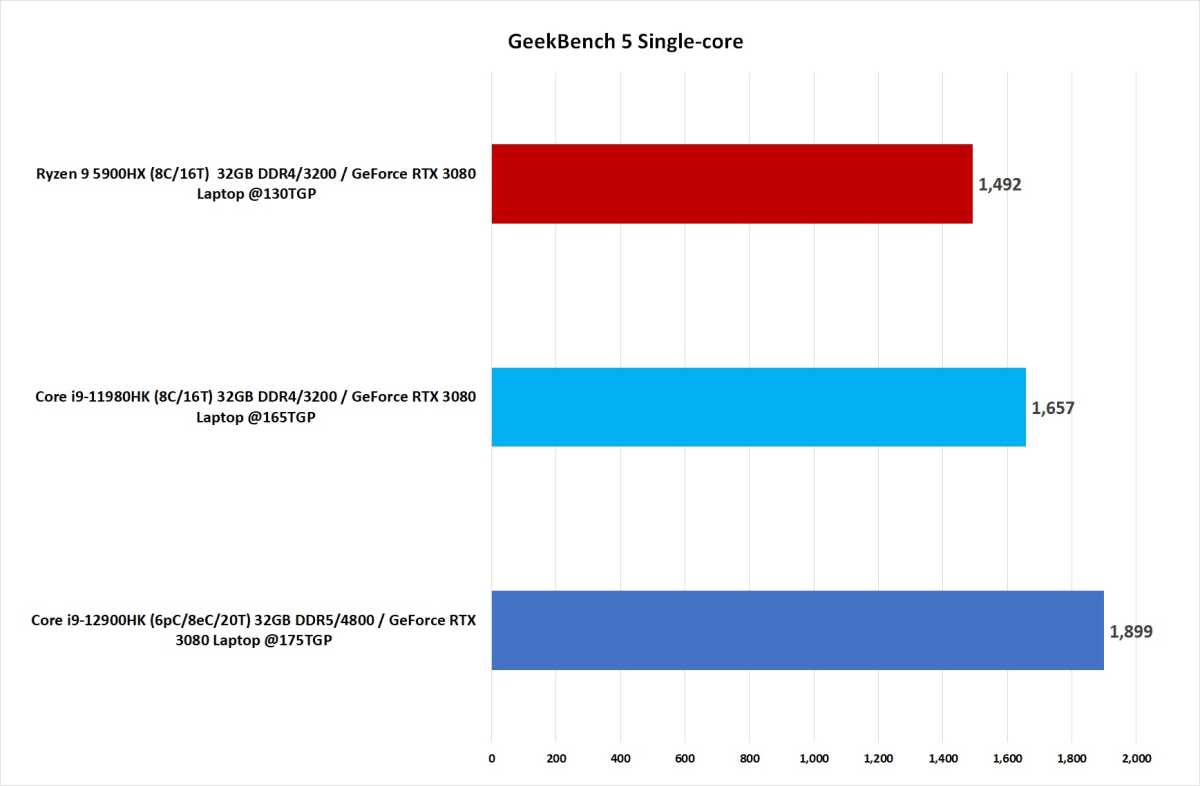
What happens when you try to deconstruct the performance of an 8-core Ryzen 9 or 11th-gen Core i9 versus a 10-core M1 Max and the 14-core Core i9-12900HK? You look at GeekBench 5’s single-core performance benchmark. Against the Ryzen 9, the 12th-gen Core i9 shows an advantage of 27 percent, and a 14.6 percent gain versus the 11th-gen Core chip.
Referencing Macworld’s review of the MacBook Pro again, we see near identical scores of 1,774 for the M1 Max and 1,778 for the M1 Pro—basically within the margin of error. That puts the Core i9-12900HK with a 6.8 percent win over the M1 Pro and M1 Max so, yes, head for Twitter folks.
Longer bars indicate better performance. Right mouse click and select “open in new tab” to see original image.
IDG
For our last score, we ran PugetBench’s Premiere Pro benchmark, but this is one test where we wonder if more tuning is yet to come. PugetBench is Puget System’s popular benchmark that measures a fairly advanced set of actions and exports in Adobe’s Premiere Pro.
We unfortunately don’t have scores for the Ryzen 9 and the 11th-gen Core i9 laptops using the current version of Premiere Pro (22.1), so we dug up some published scores from PugetBench’s database of user generated scores. Since we have no idea what conditions they were run in, we don’t have the same faith in them as the scores from, say, Macworld or other reviewers. Still we did see a score in the database of 693 for a Ryzen 9 5900HX laptop with a GeForce RTX 3080 Laptop GPU, and a score of 892 from an Core i9-11980HK laptop with a GeForce RTX 3080 Laptop GPU. The Core i9-12900HK coughed up a solid 1,037, which would make you think it’s case closed. The problem for the 12th-gen Core i9 is the reported score in PugetBench’s database for an M1 Max MacBook Pro: 1,324. Like the Ryzen 9 and 11th gen Core i9, we don’t know the conditions run for that MacBook Pro, but it’s impressive nonetheless.
At the same time, we’ve seen very large performance swings in PugetBench’s Premiere Pro benchmark based on the QuickSync capability in Intel’s integrated graphics cores. It’s entirely possible we’ll see the Core i9-12900HK’s PugetBench score move up with final drivers. And it’s also possible it won’t move at all either. We’ll have to wait and see.
And that, ultimately, is the weakness of any performance preview. While it’s been fun to see Intel’s 12th-gen Core i9-12900HK strut its stuff and outpace its Ryzen 9, 11th-gen Core i9, and M1 Max rivals in many tasks, you need to wait until we have final numbers from reviewers of final products before making any buying decisions. Hopefully you won’t have to wait long.
Editor’s note: After publication, we updated this article to tweak the color-coding in the charts for easier differentiation, and to correct the TGP info in the listings of some graph. We apologize for the error.
Note: When you purchase something after clicking links in our articles, we may earn a small commission. Read our affiliate link policy for more details.
One of founding fathers of hardcore tech reporting, Gordon has been covering PCs and components since 1998.

